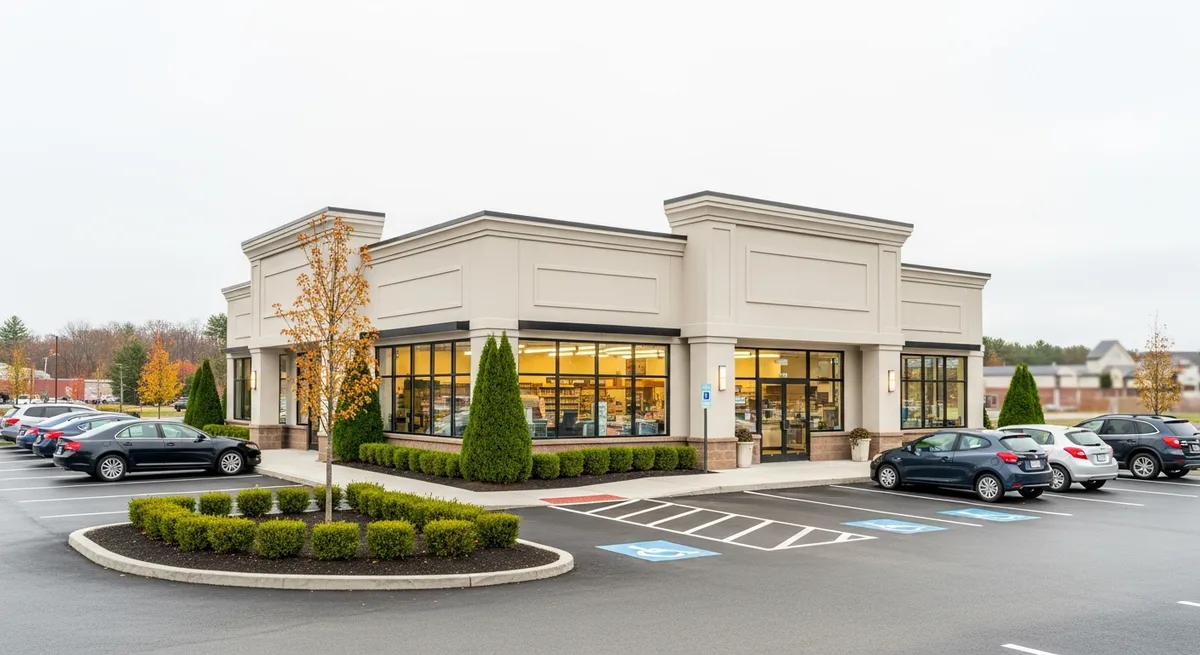
A triple net (NNN) lease is the most hands-off real estate I broker. Figure on 0-1 hours of management a month, a rent check that doesn't move, and a tenant who pays every operating expense. Per the National Association of Realtors, NNN properties leased to investment-grade tenants on 15+ year terms are trading at 5.00-5.75% cap rates right now. You get bond-like income, better tax treatment, and rent escalations written into the lease that push back against inflation.
Passive Income Potential: Single-tenant NNN properties run about 0-1 hours of management a month. It's as passive as direct ownership gets.
Predictable Returns: Investment-grade NNN with 15+ year leases trades at 5.00-5.75% cap rates today.
Tenant Responsibility: In a triple net lease the tenant pays every operating expense, taxes, insurance, and maintenance, on top of base rent.
Long-Term Stability: Initial terms usually run 10-20 years, and with options the total lease can stretch to 30-40 years.
Tax Advantages: You still get depreciation and 1031 exchange eligibility, which is where the real deferral shows up.
Triple Net (NNN) Lease is a commercial lease structure where the tenant is responsible for paying all property operating expenses, including property taxes, insurance, and common area maintenance (CAM), in addition to base rent.
Management time: 0-1 hours/month for single-tenant NNN vs. 15-20 hours for multifamily (National Association of Realtors)
Lease terms: Typical NNN leases run 10-20 years initial with options extending to 30-40 years total (CoStar Group)
Cap rate benchmarks: Investment-grade tenants at 5.00-5.75%; national credit at 6.00-7.00%; regional/franchise at 6.50-7.50% (CoStar Group)
Tax advantages: Depreciation, 1031 exchange eligibility, and potential for tax-deferred cash flow (IRS)
What a triple net lease actually is
In a triple net lease (NNN) the tenant pays every operating expense on top of base rent:
- Net of property taxes
- Net of insurance
- Net of maintenance (CAM)
You cash the rent check and carry almost no responsibility.
How NNN stacks up against other lease structures
| Expense | Gross Lease | Modified Gross | NNN Lease |
|---|---|---|---|
| Base Rent | Tenant | Tenant | Tenant |
| Property Taxes | Landlord | Varies | Tenant |
| Insurance | Landlord | Varies | Tenant |
| CAM | Landlord | Varies | Tenant |
| Roof/Structure | Landlord | Landlord | Varies* |
*Some NNN leases are "absolute NNN" where tenant handles everything.
Why investors keep coming back to NNN
1. The cash flow doesn't surprise you
Expenses aren't your problem, so your rent check stays the same whether operating costs go up or down.
2. Almost nothing to manage
Time Commitment Comparison:
| Property Type | Hours/Month |
|---|---|
| Multifamily (20 units) | 15-20 |
| Retail center (multi-tenant) | 8-12 |
| Single-tenant NNN | 0-1 |
3. Long leases
Terms typically run 10-20 years, and with options they extend to 30-40 years total.
4. Credit tenants
A lot of NNN properties are leased to investment-grade tenants: Fortune 500 companies, national retailers, government agencies.
Reading cap rates
Where NNN cap rates sit right now
| Tenant Credit | Lease Term | Cap Rate Range |
|---|---|---|
| Investment Grade | 15+ years | 5.00-5.75% |
| Investment Grade | 10-15 years | 5.50-6.25% |
| National Credit | 10+ years | 6.00-7.00% |
| Regional/Franchise | 10+ years | 6.50-7.50% |
What moves the cap rate
Lower Cap Rates: Investment-grade credit, longer term, strong location, rent increases
Higher Cap Rates: Weaker credit, shorter term, tertiary location, flat rent
The property types you'll see most
Drug Stores
| Metric | Range |
|---|---|
| Size | 10,000-14,000 SF |
| Lease term | 20-25 years |
| Cap rate | 5.25-6.25% |
Quick Service Restaurants
| Metric | Range |
|---|---|
| Size | 2,000-4,500 SF |
| Lease term | 15-20 years |
| Cap rate | 4.50-6.50% |
Dollar Stores
| Metric | Range |
|---|---|
| Size | 8,000-12,000 SF |
| Lease term | 15 years |
| Cap rate | 6.00-7.25% |
Auto Parts
| Metric | Range |
|---|---|
| Size | 6,000-8,000 SF |
| Lease term | 15-20 years |
| Cap rate | 5.75-6.75% |
Due diligence checklist
Lease Analysis
| Term | What to Look For |
|---|---|
| Lease term | Years remaining + options |
| Rent increases | Annual bumps (1.5-2.5% ideal) |
| Expense responsibility | True NNN or modified? |
| Termination | Any early termination clauses? |
Tenant Credit Analysis
For private or franchise tenants, ask for:
- Unit-level P&L
- Franchisee financial statements
- Rent coverage ratio (should be >2.0x)
The risks, and what I do about them
Tenant bankruptcy
Mitigation: Focus on essential retail (pharmacy, grocery, auto)
Lease expiration
Mitigation: Buy longer terms; analyze market rent vs. contract rent
Interest rates
Mitigation: Use fixed-rate financing; match loan term to hold period
Obsolescence
Mitigation: Consider building's alternative use value
""NNN properties remain the gold standard for passive income in commercial real estate. The combination of credit tenancy, long lease terms, and minimal management creates an income stream that closely resembles a bond but with inflation protection through rental escalations," says **Todd Lornell**, Principal & Founder, Lornell Real Estate
Lornell Real Estate helps investors source NNN opportunities across Central Massachusetts and New England. Get in touch and we'll talk through your investment criteria.
Limitations: Cap rates, pricing, and transaction volume cited reflect market-level averages at the time of publication and may not apply to individual properties. Property values depend on asset-specific factors including condition, tenant credit quality, lease terms, location, and financing structure. Tax rules (including 1031 exchange provisions, capital gains rates, and depreciation schedules) change with legislation. This article does not constitute investment, tax, or legal advice. Consult a qualified CPA, attorney, and commercial real estate broker before making transaction decisions.
Sources & References
- CoStar
- CoStar Group
- IRS
- National Association of Realtors
This article cites data from the sources listed above. For the most current figures, consult the original publications directly.
Data current as of publication date. Market conditions, rates, and regulations may have changed. Consult a qualified commercial real estate professional before making investment decisions.
Get the full Central MA market data
Commercial tax-base growth, development activity, and demographics across Central MA, town by town.