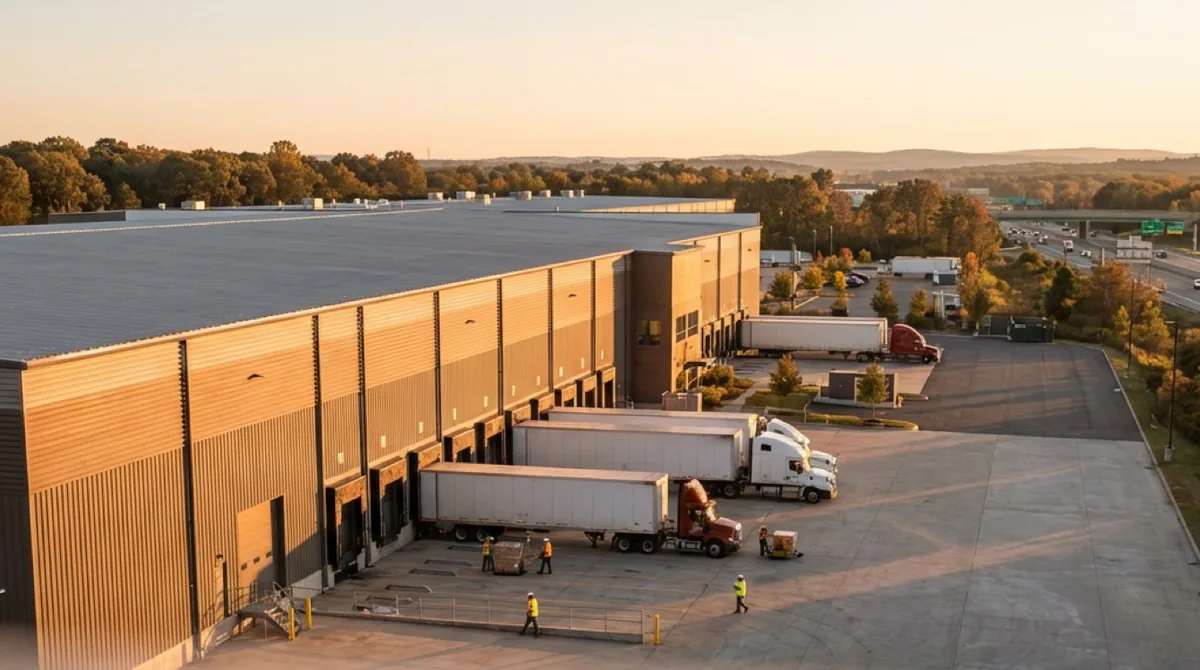
In August we published our Q3 2026 Worcester Market Update, a seven-page read of what changed in the five weeks after the Mid-Year report. The Mid-Year ran on CoStar data through 3 July 2026; CoStar refreshed the Worcester market on 10 August. Four sectors moved, one of them sharply, and the gap this firm has been writing about all year got wider, not narrower. The download is free. This article covers the highlights.
Investment sales were flat at $1.18 billion, down from $1.19 billion, but the mix rotated: industrial gained $76 million of trailing volume and multifamily gave up $114 million.
The small-bay gap widened. Industrial space of 20,000 SF and under is 3.9% vacant, down from 4.4%, while the headline is 9.3% and buildings over 200,000 SF sit at 14.2%.
Office absorption flipped positive, from negative 161,000 SF to positive 123,000 SF, and vacancy fell 0.8 points to 9.4%. Almost all of it happened in mid-tier 3 Star space.
Industrial pays 291 basis points over the 10-year Treasury, ten tighter than at mid-year, because cap rates compressed while the 10-year held at 4.69%.
Outlying Worcester runs half the metro's office vacancy at 4.4%, and its 12.1% industrial figure is a story about a few large speculative boxes, not the towns.
The scoreboard: flat on the surface, rotating underneath
Total investment sales across the four sectors barely moved, from $1.19 billion to $1.18 billion12-Month Investment Sales over the trailing twelve months. The composition rotated hard. Industrial gained $76 million of trailing volume and retail $32 million; multifamily gave up $114 million as 2025's large apartment trades rolled out of the twelve-month window.
| Sector | Vacancy | Mid-Year | Asking Rent | 12-Mo Sales | Cap Rate |
|---|---|---|---|---|---|
| Industrial | 9.3% | 9.4% | $10.94 | $454.7M | 7.6% |
| Retail | 3.3% | 3.3% | $17.88 | $268.0M | 7.5% |
| Office | 9.4% | 10.2% | $24.94 | $82.7M | 9.3% |
| Multifamily | 6.2% | 6.5% | $2,102 | $379.5M | n/a |
Source: CoStar, trailing twelve months. Vacancy and rent as of 10 August 2026 against 3 July 2026; sales volume was $378.6M, $236.0M, $82.6M and $493.5M at mid-year. The cap rate is the average across CoStar's recorded arm's-length sale comparables for the period: 85 industrial, 143 retail and 64 office. CoStar does not publish a comparable cap rate for multifamily; the average price per unit fell from $267,000 to $248,000.
Industrial: the gap got wider
Headline vacancy fell a tenth of a point, to 9.3%. Underneath it the two ends of the market moved in opposite directions. Space of 20,000 SF and under is now 3.9% vacant, down from 4.4%. Space of 200,000 SF and over eased only from 14.4% to 14.2%, so the spread between the two size bands widened from 10.0 to 10.3 points.
| Measure | Q3 2026 | Mid-Year | Move |
|---|---|---|---|
| Vacancy, 20,000 SF and under | 3.9% | 4.4% | -0.5 pts |
| Vacancy, 200,000 SF and over | 14.2% | 14.4% | -0.2 pts |
| Logistics segment vacancy | 9.8% | 10.3% | -0.5 pts |
| Market asking rent | $10.94 | $10.83 | +1.0% |
| Trailing 12-month sales | $454.7M | $378.6M | +20.1% |
| Average price per SF, sale comparables | $160 | $154 | +3.9% |
Of the 2.41 million SF under construction, 2.25 million SF (93%) is logistics, 164,000 SF is flex and none is specialized industrial. Small-bay stock received no meaningful new supply again this period, which is why the 3.9% figure keeps falling while the headline does not. Rent growth moved from 3.7% to 4.0%, against a US average rent of $12.20.
One correction. In our Mid-Year commentary we read CoStar's narrative as reporting negative net absorption of 990,000 SF. We now believe the cover figure of 994,000 SF was right and the narrative sentence was wrong; the August report is internally consistent at positive 895,000 SF. Worcester industrial absorbed space over the last twelve months. It did not shed it. Vacancy rose because deliveries ran ahead of absorption, not because tenants left.
If you own small-bay industrial, your segment is at 3.9% vacancy, the tightest print in this series, while the headline quoted at you is 9.3%. If a broker or an appraiser has used the market average to argue your building is worth less, ask which size band the figure describes.
Office: tenants traded down, and it worked
Office produced the largest move in this update. Twelve-month net absorption went from negative 161,000 SF to positive 123,000 SF, and vacancy fell 0.8 points to 9.4%. Almost all of it happened in one segment: mid-tier 3 Star space absorbed 353,107 SF in the quarter while top-tier 4 and 5 Star space gave back 51,968 SF and 1 and 2 Star space added 7,000 SF.
The quality curve is still upside down. 4 and 5 Star space is 16.4% vacant, up from 13.9%, and asks $24.78 per SF. 3 Star space is 10.7% vacant, down from 12.7%, and asks $26.87. 1 and 2 Star space is 5.5% vacant at $21.84. The best-rated space is the emptiest and it is not the most expensive: 3 Star asks $2.09 per SF more than 4 and 5 Star and is 5.7 points less vacant.
For an owner of 3 Star office this is the first genuinely encouraging print in some time. For an owner of top-tier space, the 16.4% figure and the 189,500 SF still under construction in that tier (of 204,000 SF market-wide) are the numbers to watch. Sales volume was unchanged at $82.7 million, and the average cap rate across 64 recorded sale comparables came in at 9.3%, down from 9.7%, at $99 per SF and an average vacancy at sale of 35.7%.
Retail did not move; multifamily supply landed
Retail vacancy held at 3.3%, rent at $17.88 and the pipeline at 24,408 SF. Sales rose 13.6% to $268.0 million on the same tight stock, at an average of $171 per SF across 143 comparables.
Multifamily deliveries rose from 789 to 1,316 units, and vacancy still fell, from 6.5% to 6.2%, because absorption more than doubled to 902 units. Rent growth stopped: asking growth is 0.0% and effective growth is negative 0.4%, so concessions are doing the work. Trailing sales fell 23.1% to $379.5 million as the 2025 trades left the window, and the average price per unit fell from $267,000 to $248,000.
Capital markets: what you are paid to be here
A cap rate on its own says very little. What matters is how much of it survives the cost of money. With the 10-year Treasury at 4.69% on 6 August 2026, the spread is the number we will track hardest from here.
| Sector | Cap Rate Q3 | Cap Rate Mid-Year | Spread Now | Spread Mid-Year | Price/SF |
|---|---|---|---|---|---|
| Industrial | 7.6% | 7.7% | 291 bps | 301 bps | $160 |
| Retail | 7.5% | 7.3% | 281 bps | 261 bps | $171 |
| Office | 9.3% | 9.7% | 461 bps | 501 bps | $99 |
Industrial tightened by ten basis points, and it moved because cap rates compressed rather than because rates rose; the 10-year sat at 4.69% on both readings. Price per SF on recorded comparables went from $154 to $160 in five weeks, on 85 sales against 82. Retail is the only sector where the spread improved for a buyer, from 261 to 281 basis points, on fewer trades (143 against 150) at a higher average price. Office pays the widest spread in this market and carries the widest risk with it, at 35.7% average vacancy at sale.
Outlying Worcester, on its own
Spencer, Webster, Leicester, Oxford, Southbridge and Auburn do not get their own market reports. They sit inside a CoStar submarket called Outlying Worcester, which holds roughly 40% of the metro's industrial inventory, so every metro figure in this update is partly a figure about these towns. This edition breaks the submarket out for the first time.
| Sector | Outlying Worcester | Worcester metro |
|---|---|---|
| Office vacancy | 4.4% | 9.4% |
| Retail vacancy | 3.7% | 3.3% |
| Industrial vacancy, all sizes | 12.1% | 9.3% |
| Industrial vacancy, 200,000 SF and over | 22.1% | 14.2% |
Read the bottom row first; it explains the one above it. At 12.1% the submarket's industrial vacancy looks worse than the metro's, and taken alone that reads as a weak market. It is not. Vacancy for buildings of 200,000 SF and over out here is 22.1%: a small number of large speculative boxes are carrying almost the whole number. Net absorption was negative 82,000 SF, an improvement on negative 148,000 SF at mid-year, rent growth of 4.1% ran ahead of the metro's 4.0%, and the pipeline is 1.3 million SF, 2.9% of existing inventory. Trailing sales volume was $100 million.
Office and retail quietly outperform. Outlying office vacancy is less than half the metro's, on 6.7 million SF of inventory, with an availability rate of 7.4%, nothing under construction, and a five-year average of 5.4%, so it is tight against its own history as well. Outlying retail sits at 3.7% with rents of $16.30, about $1.58 below the metro, on 85,000 SF of absorption against 19,000 SF of net deliveries and 12,000 SF under construction across the entire submarket.
What I'd tell you if you own here
- Small-bay industrial owners: your product is 3.9% vacant and the gap to the headline widened again. Price it on your size band, not the market average.
- Office owners: 3 Star space absorbed 353,000 SF this quarter and its vacancy fell two points, the strongest leasing evidence in eighteen months. 4 and 5 Star vacancy rose to 16.4% with 189,500 SF still to deliver.
- Apartment owners: vacancy improved to 6.2% and absorption doubled. Asking rent growth is 0.0% and effective growth is negative 0.4%. Underwrite flat rents, and expect a buyer to do the same.
- Buyers: industrial pays 291 basis points over the 10-year, ten tighter than at mid-year, from cap rate compression rather than rates. Retail is the only sector where the spread moved your way. Office pays the most and carries 35.7% average vacancy at sale.
Which cap rate this is
CoStar publishes two. A modelled Market Cap Rate, shown only as a chart, and an average across recorded arm's-length sale comparables. Every cap rate in this update is the second one, with the comparable count stated, because it is reproducible from the report text. Our Mid-Year report quoted the modelled figure of 7.8% for industrial; the two are not interchangeable and we will use the comparable average from here on. CoStar's Capital Markets Overview and Sale Trends sections also failed to generate for the second consecutive month, so pricing and cap rate detail comes from the Sales Past 12 Months sections instead. We have raised it with CoStar.
The full update includes the sector scoreboard against mid-year, the industrial size-band and pipeline detail, office absorption and vacancy by building quality, cap rate spreads drawn to scale, and the Outlying Worcester submarket on its own. It is free: enter your email in the banner at the top of this article and we will send it to you.
Tell us the town where you own and we will run a parcel-level ownership and turnover summary from the assessor records and send it back, no charge and no follow-up sequence. Call Collin Mulcahy at 774-230-3634 or email collin@lornellre.com.
Get the full Central MA market data
Commercial tax-base growth, development activity, and demographics across Central MA, town by town.