Markets We Serve
Worcester, MA Commercial Real Estate
For Sale and For Lease
The market we know best, from the office we work out of.
Worcester is the second-largest city in New England, with a population over 206,000. It sits where I-90, I-290, and I-190 meet, and it's the economic hub of Central Massachusetts. The economy here runs across healthcare, education, manufacturing, and professional services, so no single sector carries the whole town. We are headquartered downtown at 250 Commercial Street, and Worcester is where most of our deals close.
205,501
Population
$13.28 residential / $29.06 commercial
Tax Rate / $1,000 (FY2026)
2
Available Properties
$67,544
Median Household Income
Worcester is where Lornell Real Estate is headquartered, and it is the market this page is built around: what is for sale and for lease right now, what the buildings are trading for, which corridors are moving, and what the tax and zoning rules do to your numbers. The figures below come from CoStar’s Worcester market data through Q3 2026 and from the city’s own sales, permit, and business records. We update them as each report lands.
Commercial property for sale in Worcester
Worcester recorded 51 commercial sales totaling $243.7 million in 2025, a 30% increase over 2024 and more than six times the 2020 figure. The average sale climbed from $1.2 million in 2020 to $4.8 million in 2025, which tells you the institutional buyers came back. Five of the ten largest trades were factories or industrial warehouses, three were hotels, and the biggest was a $100 million mixed-use building at 16 Laurel Street.
The spread in pricing is what makes the city work for different kinds of buyers. A 283,000 square foot industrial warehouse on Southbridge Street traded at $28 per square foot. The Laurel Street mixed-use asset traded at $364. Between those two numbers you will find storefront retail on Main Street and Shrewsbury Street, professional office suites, small-bay industrial buildings, triple-deckers and apartment blocks, and infill land. Our active Worcester listings are below, and we run a steady book of off-market opportunities for buyers who tell us what they want.
For sellers, the record volume and the return of larger buyers mean the bid is real again. We start every disposition with a Broker Opinion of Value that pulls from these same city records, so you see the actual comparable sales before you decide on a price.
Industrial: tight small-bay, loose big-box
The Worcester industrial market holds about 120 million square feet across Worcester County and Windham County, Connecticut. Nearly 1.9 million square feet of new space delivered over the past year, and overall vacancy rose to 9.3% while the market digests it. Almost all of that vacancy is in speculative logistics buildings over 200,000 square feet, which run 14.2% vacant. Small-bay space under 20,000 square feet is 3.9% vacant, and inside the city that is the product owner-users and contractors actually want.
Asking rents average $10.94 per square foot and rose 4.0% on the year. Older mill and manufacturing buildings with limited loading lease under that number on a NNN basis; modern space with 24-foot clear height asks over it. That is still 30 to 50% under comparable space inside Route 128, which is why tenants from Greater Boston keep showing up at Gold Star Boulevard, Northeast Cutoff, and the Southbridge Street corridor. CoStar projects industrial rent growth of roughly 3.5% a year through 2030, the fastest of any sector here.
Retail and restaurants: the tightest sector on record
Retail vacancy across the Worcester market fell to 3.3%, the lowest CoStar has recorded, on about 500,000 square feet of positive absorption. The construction pipeline is 24,000 square feet against 49 million square feet of inventory, and roughly 270,000 square feet has been demolished over the past three years. The supply base is shrinking while demand keeps arriving, and CoStar forecasts the same 3.3% through 2030.
Inside the city, the demand is food-led. Worcester issued 1,212 food establishment licenses across 848 locations in 2025, more than triple the 2024 count, concentrated in the Canal District, on Shrewsbury Street, and downtown. Institutional money followed: the CVS-anchored Goldstar Crossing sold for $31 million, or $465 per square foot. For a retail owner that is the strongest pricing leverage in years. For a tenant it means starting the search early and being ready to move when a storefront on the right block opens.
Office: functional beats fancy
Office vacancy across the Worcester market is 9.4%, and the quality curve runs opposite the national script. The 4 and 5 Star buildings are the soft part of the market, at 16.4% vacant and asking less than mid-tier space. Older 1 and 2 Star buildings sit at 5.5% vacancy. Affordable, functional space with parking is what leases, and the average asking rent across the market is $24.94 per square foot. Office absorption turned positive in the third quarter at about 123,000 square feet after a long stretch of givebacks.
The buyers are now the users. UMass Memorial bought the 265,000 square foot Worcester Business Center it partly occupied for $14 million, about $53 per square foot. Webster Five Bank signed the year’s largest lease at 35 Millbury Street. For an owner of an older downtown building, that is the play: sell or lease to the operator who wants to be here, or convert to residential, which in Worcester is a live option rather than a theory.
Multifamily and mixed-use
Multifamily sales were $379.5 million over the trailing year, down 23% from the $493 million year to July that ran 66% above the five-year average, a year led by Morgan Stanley’s $157 million purchase of Aria on the Row and Jones Street’s $122 million purchase of 145 Front at City Square at a 5.0% cap rate. Per-unit pricing rose from $207,000 in 2023 to $243,000 in 2026. Roughly 1,316 new units delivered over the year and vacancy still eased to 6.2%, because absorption more than doubled; CoStar projects it back near 5% by 2028.
The 2026 buyer mix flipped toward local owners while national institutions became net sellers, which is where we spend most of our time: triple-deckers, six-to-thirty unit buildings, and mixed-use with retail below and apartments above. Realtor.com ranked Worcester the number three housing market in the country for 2026, and the rental fundamentals have supported buyers who came here on yield.
Taxes, zoning, and what the split rate means for your numbers
Worcester classifies property for tax purposes. The FY2026 rates are $13.28 per $1,000 for residential and $29.06 per $1,000 for commercial, industrial, and personal property. On a NNN lease that pass-through lands on the tenant. Model it before you compare a Worcester building against one in Auburn at $14.24 or Leicester at $11.77. The city’s 1,136 commercial, industrial, retail, and mixed-use parcels are assessed at more than $2.5 billion combined.
Zoning follows the corridors. Business General (BG) covers the downtown and arterial retail, Business Limited (BL) the neighborhood commercial nodes, and Manufacturing Light (ML) and Manufacturing General (MG) the industrial spine along I-190, Route 20, and the rail lines. Overlay districts and the Opportunity Zone that covers the Canal District change what a parcel can carry, and commercial permits ran to a record 2,666 in 2024. When a client is weighing a site, we pull the zoning, the overlay, and the permit history before we talk about price.
Services
What we do in Worcester
Investment sales
Dispositions and acquisitions across industrial, retail, office, and multifamily in the city
Leasing advisory
Landlord and tenant representation on Worcester storefronts, offices, and industrial
Development consulting
Site selection, zoning, and feasibility for infill and adaptive reuse projects
Property management
Operations and reporting for Worcester commercial and mixed-use buildings
Browse by Property Type
Worcester commercial space by use
Commercial property for sale
Buildings and land on the market in Worcester
Commercial space for lease
Retail, office, and industrial availabilities
Industrial space
Warehouse, manufacturing, and flex
Warehouse for rent
Small-bay and distribution space
Retail space for rent
Storefronts and restaurant space
Office space for rent
Downtown and professional suites
Medical office space
Near the UMass Memorial campuses
Commercial land for sale
Infill and development sites
Invest in Worcester
Cap rates, yields, and the investment case
Commercial Corridors
Key Business Districts
Downtown / Main Street
Class A and B office, ground-floor retail, and the mixed-use conversions between City Hall and Union Station
Canal District / Kelley Square
Polar Park, restaurant row on Green Street and Water Street, 800+ apartments in the pipeline, federal Opportunity Zone
Shrewsbury Street
Restaurant and neighborhood retail corridor east of downtown
Gold Star Boulevard / Northeast Cutoff
Industrial and manufacturing corridor along I-190 and Route 12; the year’s largest factory trades landed here
Southbridge Street / Route 20
Industrial warehouse and distribution toward the Auburn interchange, plus auto-oriented retail
Lincoln Street / Green Hill Parkway
Medical office, flex space, and the retail strip along Route 70 toward Lincoln Plaza
Zoning
Zoning Districts
Regional Access
Transportation
I-90 (Mass Pike): 45 minutes to Boston, 90 minutes to Hartford
I-290: Connects to I-495 and eastern suburbs
I-190: North to Leominster and Route 2
Route 146: South to Millbury, the Blackstone Valley, and Providence
MBTA Commuter Rail (Union Station): Framingham/Worcester Line to Boston South Station
Worcester Regional Airport (ORH): Commercial flights to major hubs
Economic Base
Major Employers
UMass Memorial Health Care
Healthcare
UMass Chan Medical School
Healthcare & Research
Worcester Polytechnic Institute (WPI)
Education
College of the Holy Cross
Education
Clark University
Education
Saint-Gobain (Norton Abrasives)
Manufacturing
Hanover Insurance
Insurance
Unum
Insurance
Top Employment Sectors
45,000
Healthcare & Education
18,000
Professional Services
12,000
Manufacturing
Investment Thesis
Why Worcester?
Worcester grew 14.1% between 2010 and 2020, faster than any other New England city over 100,000, and Realtor.com ranked it the number three housing market in the country for 2026. The commercial side kept pace: $243.7 million in city commercial sales across 51 transactions in 2025, up 30% on the year, and $1.18 billion in investment sales across the wider Worcester market over the trailing twelve months. Retail vacancy is 3.3%, the lowest CoStar has recorded here. Small-bay industrial under 20,000 square feet sits at 3.9% even while the big speculative boxes lease up. Rents run well under comparable Boston space, and you still reach the same labor pool off the commuter rail.
Common Questions
Worcester Commercial Real Estate FAQ
Worcester trades across the full range: industrial and warehouse buildings along Gold Star Boulevard, Northeast Cutoff, and Southbridge Street; storefront retail and restaurant space in the Canal District, on Shrewsbury Street, and downtown; office buildings from Class A towers to small professional suites; multifamily from triple-deckers to 200-unit complexes; and mixed-use and development land. In 2025 the city recorded 51 commercial sales totaling $243.7 million, from a $28 per square foot industrial warehouse to a $364 per square foot mixed-use building.
Worcester uses a split tax rate. For FY2026 the City Council set $13.28 per $1,000 of assessed value for residential property and $29.06 per $1,000 for commercial, industrial, and personal property. The commercial rate is higher than in surrounding towns like Auburn ($14.24) and Leicester ($11.77), so on a net lease the tax line is worth modeling before you sign. Worcester offsets it with the labor pool, highway and rail access, and tenant demand the suburbs cannot match.
Across the CoStar Worcester market, asking rents in Q3 2026 averaged $10.94 per square foot for industrial, $17.88 for retail, and $24.94 for office. Inside the city, older industrial with limited loading leases below that average on a NNN basis, while modern high-clear space asks above it. Well-located retail and restaurant space in the Canal District and on Shrewsbury Street prices above the market average. Operating expenses, the tax pass-through, and tenant improvement allowances move the real number more than the headline rent does.
Yes, with a distinction by building size. Nearly 1.9 million square feet of new industrial space delivered across the Worcester market in the past year, pushing overall vacancy to 9.3%, but that vacancy sits almost entirely in large speculative logistics buildings over 200,000 square feet. Small-bay space under 20,000 square feet is 3.9% vacant, and the largest trades of the past two years were factories and warehouses inside the city. CoStar forecasts industrial rent growth of about 3.5% a year through 2030, the fastest of any sector.
It depends on the asset. For retail and restaurants, the Canal District has the strongest momentum: assessed values there are up 83% since Polar Park opened in 2021, the district sits inside a federal Opportunity Zone, and it has over 800 apartment units in the pipeline. Shrewsbury Street and downtown Main Street are the other proven retail corridors. For industrial, look at Gold Star Boulevard, Northeast Cutoff, and the Southbridge Street corridor toward Auburn. For medical office and flex, Lincoln Street and Green Hill Parkway near the UMass Memorial campuses.
Lornell Real Estate is a commercial real estate brokerage headquartered at 250 Commercial Street in downtown Worcester, founded in 2025 and licensed in MA, CT, RI. The team is Todd Lornell (Principal & Founder), Collin Mulcahy (President), and Michael Murray (Advisor). The firm handles investment sales, leasing advisory, buyer representation, and development consulting for retail, industrial, office, flex, and multifamily property in Worcester and across Worcester County. Reach the office at (774) 745-0015.
Worcester is the second-largest city in New England, with a population over 206,000 that grew 14.1% between 2010 and 2020. Commercial sales volume in the city hit a record $243.7 million in 2025, commercial building permits reached a record 2,666 in 2024, and the city averages about 920 new business certificates a year. Retail vacancy is a record-low 3.3%, multifamily traded $379.5 million over the trailing year, and cap rates run 200 to 300 basis points over Boston. The city sits at the intersection of I-90, I-290, and I-190 with commuter rail to Boston and about 45,000 healthcare and education jobs.
Development Momentum
Market Activity & Intelligence
14
New Construction Permits (12mo)
557
Commercial Renovations (12mo)
11
Change of Use Permits (12mo)
937
New Business Filings (12mo)
Notable Recent Activity
173 LINCOLN ST
Addition
Oct 2025
73 MERRICK ST
New Construction
Sep 2025
105 STAFFORD ST
New Construction
Sep 2025
33 WALDO ST
Change of Use
Aug 2025
35 RICHARDS ST
Change of Use
Aug 2025
Data sourced from City of Worcester permit records. Last generated: November 2025
Available Listings
Our Properties in Worcester
Track Record
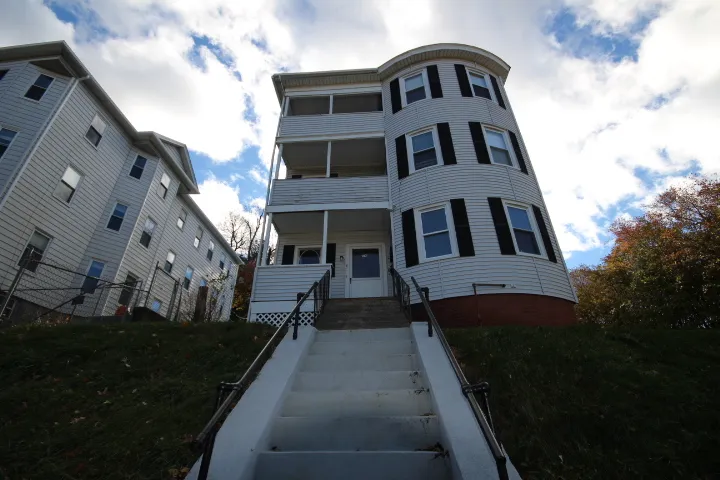
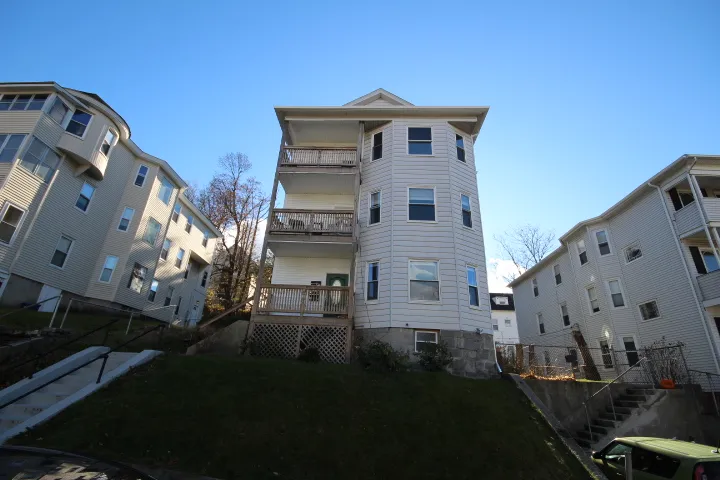
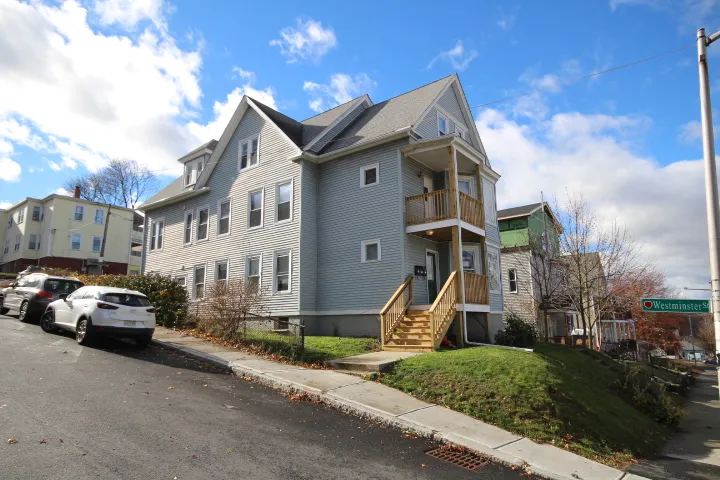
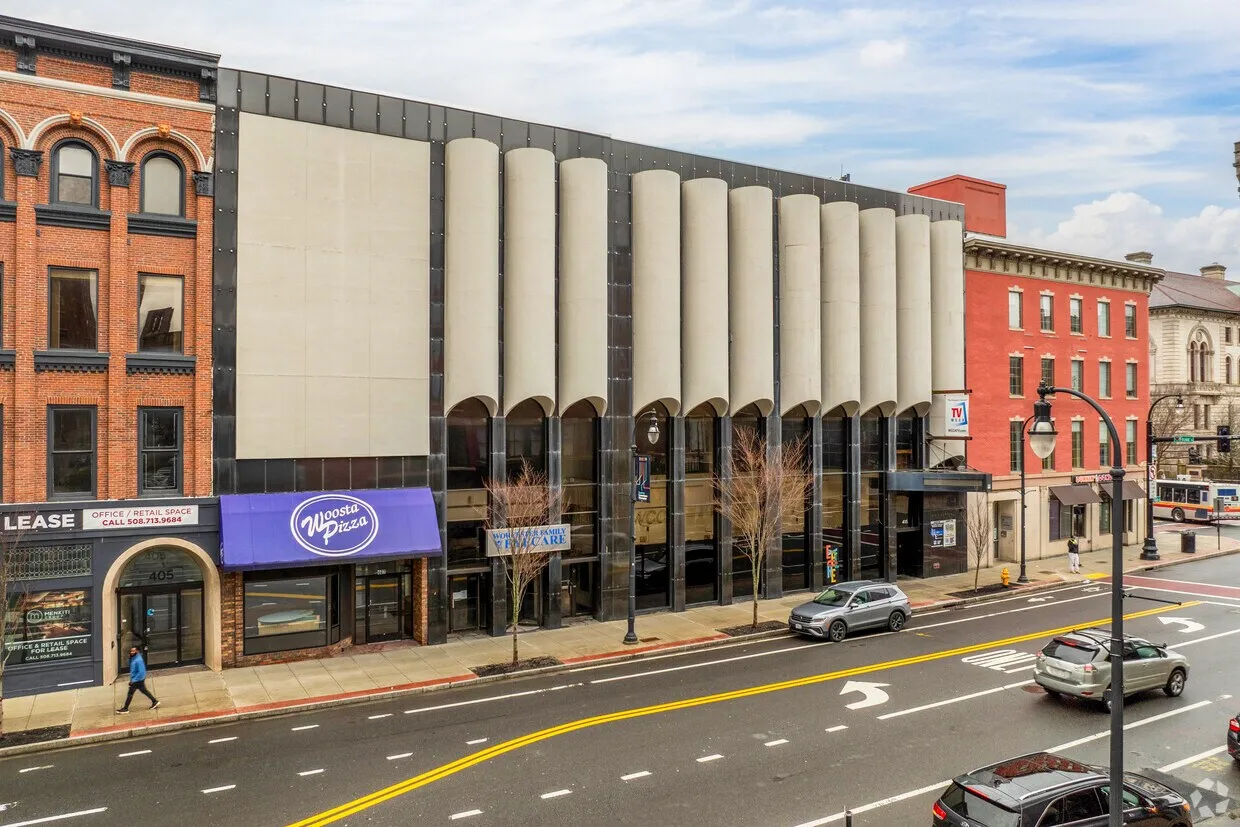
Recently closed in Worcester
Market Research
Latest on Worcester commercial real estate
Market Analysis
Fall 2026 Ground-Level Report: What the City's Records Say About Worcester Commercial Real Estate
Oct 6, 2026 · 8 min read
Market Analysis
Q3 2026 Market Update: What Moved in Worcester Commercial Real Estate, and What Did Not
Oct 6, 2026 · 8 min read
Market Analysis
Mid-Year 2026 Market Report: Worcester Commercial Real Estate
Jul 22, 2026 · 9 min read
Market Analysis
How Much Does It Cost to Lease Commercial Space in Worcester?
Mar 11, 2026 · 10 min read
Market Analysis
Worcester Commercial Real Estate by the Numbers: 2025 Market Data Report
Mar 5, 2026 · 10 min read
Market Analysis
Where Worcester Is Building: Commercial Permit Activity by Neighborhood (2023-2025)
Mar 5, 2026 · 8 min read
Explore Our Markets
Other Areas We Serve
For Property Owners
Thinking of Selling in Worcester?
Whether you own a warehouse, retail building, or industrial property in Worcester, our team provides a complimentary Broker Opinion of Value with no obligation. Get a data-backed answer to what your property is worth in today's market.
Request a Free ValuationDownload the Worcester market report
Nine pages from the city's own records: where commercial owners have stopped spending, why fewer buildings trade at higher prices, who owns commercial Worcester, and the land zoned for more than is built on it. Delivered to your inbox.
Get Local Expertise
Looking for space in Worcester?
Lornell Real Estate is headquartered in Worcester at 250 Commercial Street, Suite 220. Contact us for local market expertise and off-market opportunities.
Send Us a Message
Fill out the form below and we'll get back to you as soon as possible.
Market data last updated: September 2026. Sources: Town Assessor, U.S. Census, MA DOR.