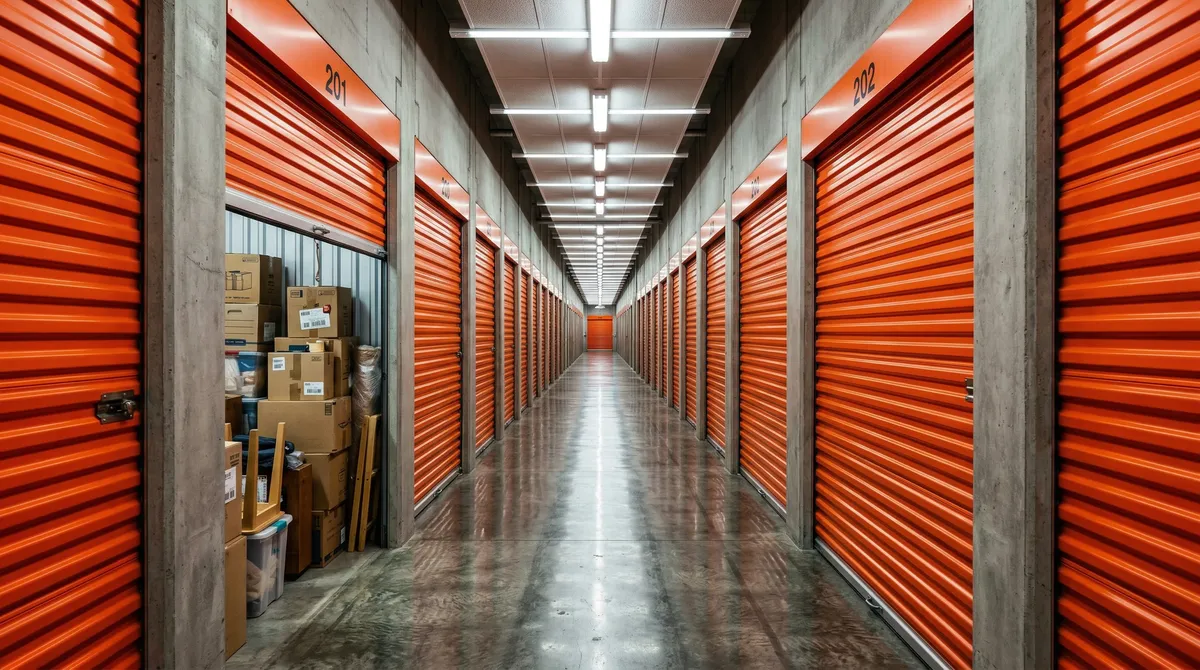
Over the past 25 years, self-storage has posted a 17.4% annualized return per NCREIF, ahead of every other commercial property type. Meanwhile Central Massachusetts runs 45% below the national average on storage per capita. The Self Storage Association's numbers show the sector stayed in the black through the 2001, 2008-2009, and 2020 recessions. In 35 years of brokering deals here, I've watched a lot of "safe" asset classes get cut in half. This one didn't.
Returns: Self-storage has run a 17.4% annualized return over 25 years, ahead of every other commercial real estate sector.
Recession record: The sector held positive returns through most recent recessions, including 2001 and 2020, and lost the least of any sector in 2008-2009.
Supply gap: Central Massachusetts has 45% less storage per capita (5.1 SF) than the national average (9.4 SF).
Margins: Self-storage facilities run NOI margins of 60-65%, among the highest in commercial real estate.
NOI Margin is the percentage of a property's gross revenue remaining after deducting all operating expenses but before debt service and capital expenditures, indicating operational profitability.
25-year annualized return: 17.4% for self-storage, outperforming industrial (12.8%), retail (11.2%), and office (9.6%) (NCREIF)
Central MA supply gap: 5.1 SF per capita vs. 9.4 national average, representing 45% less storage capacity (Self Storage Association)
NOI margins: 60-65%, among the highest in commercial real estate (Marcus & Millichap)
Recession resilience: Only -3.8% during 2008-2009 crisis, best of all CRE sectors; +8.1% during COVID (NCREIF)
Why storage beats the rest on the numbers
Over the past 25 years, self-storage has out-earned every other property type. Here's the track record.
The track record
Historical Returns (1994-2024):
| Property Type | Annualized Return |
|---|---|
| Self-Storage | 17.4% |
| Industrial | 12.8% |
| Retail | 11.2% |
| Apartments | 10.9% |
| Office | 9.6% |
During Recessions:
| Recession | Self-Storage Performance |
|---|---|
| 2001 (Dot-com) | +5.2% |
| 2008-2009 (Financial Crisis) | -3.8% (best of all sectors) |
| 2020 (COVID) | +8.1% |
What drives the demand
The four D's
People fill storage units for four reasons, and none of them care what the economy is doing.
1. Death: Estate cleanouts require temporary storage (3-12 months)
2. Divorce: Household splitting creates immediate need (6-18 months)
3. Dislocation: Job changes, relocations, life transitions (3-24 months)
4. Downsizing: Seniors and empty nesters reducing space (often permanent)
How the money works
Revenue Characteristics:
- Highly fragmented customer base (no tenant >1% of revenue)
- Month-to-month leases allow frequent rate increases
- Low customer acquisition costs
- Sticky customers (average tenure: 14 months)
Typical Facility Economics:
| Metric | Value |
|---|---|
| Gross Revenue | $12-18/SF annually |
| Operating Expenses | 35-40% of revenue |
| NOI Margin | 60-65% |
| Cap Rate (stabilized) | 5.5-7.0% |
Where Massachusetts stands
State Statistics:
- Total inventory: 45 million SF
- SF per capita: 6.5 (below national average of 9.4)
- Occupancy: 91%
- Average rental rate: $1.45/SF/month
Central Massachusetts:
- Inventory: 4.8 million SF
- Population served: 950,000
- SF per capita: 5.1 (significantly underserved)
- Occupancy: 93%
- Average rate: $1.25/SF/month
Central Massachusetts sits 45% below the national average on storage per capita. That's a supply gap, plain and simple.
The three ways to build it
Traditional drive-up
- Single-story buildings
- Individual exterior unit doors
- Lower construction cost ($45-60/SF)
- Best for: Suburban/rural markets
Climate-controlled
- Multi-story buildings
- Interior hallways
- Higher construction cost ($85-120/SF)
- Best for: Urban/suburban markets, premium positioning
Conversions
Buildings worth a second look for reuse:
- Vacant big-box retail (Kmart, Sears)
- Industrial buildings
- Office buildings
Conversion Economics:
- Acquisition: $30-60/SF
- Conversion: $25-45/SF
- Total basis: $55-105/SF (vs. $100-140 new construction)
Development and acquisition
What a site needs
| Factor | Target |
|---|---|
| Lot size | 2-5 acres |
| Visibility | High (arterial road frontage) |
| Traffic count | 15,000+ ADT |
| Population (3-mile) | 25,000+ |
| Competition | <7 SF/capita in trade area |
What the returns look like
Stabilized Facility Example:
Assumptions:
- 50,000 rentable SF
- 92% occupancy
- $1.35/SF/month average rate
| Metric | Amount |
|---|---|
| Gross Potential Revenue | $810,000 |
| Less: Vacancy (8%) | ($64,800) |
| Effective Revenue | $745,200 |
| Plus: Ancillary Income | $45,000 |
| Total Revenue | $790,200 |
| Operating Expenses (38%) | ($300,000) |
| NOI | $490,200 |
At 6.5% Cap Rate: Value = $7.54 million ($151/SF)
Where I'd look in Central Mass
The underserved markets
| Market | Population | Current SF | SF/Capita |
|---|---|---|---|
| Worcester (urban core) | 206,000 | 890,000 | 4.3 |
| Leominster/Fitchburg | 85,000 | 380,000 | 4.5 |
| Milford/Hopedale | 45,000 | 185,000 | 4.1 |
| Webster/Dudley | 28,000 | 95,000 | 3.4 |
Corridors to watch
Where I'd put a facility:
- Route 9 corridor (Shrewsbury, Westborough)
- Route 20 corridor (Auburn, Oxford)
- I-290 exits (Worcester suburbs)
- Route 2 corridor (Leominster, Fitchburg)
Lornell Real Estate keeps an eye on self-storage opportunities across Central Massachusetts. Call us if you want to talk through development sites or acquisition targets.
Limitations: Market data, projections, and trend analyses reflect conditions at publication. Commercial real estate markets are inherently cyclical, and submarket and property-level performance can diverge significantly from the regional averages cited. Demographic data, employer information, and regulatory conditions are subject to change. This article does not constitute investment advice. Conduct property-specific due diligence and consult qualified professionals before making investment decisions.
Sources & References
- Marcus & Millichap
- NCREIF
- Self Storage Association
This article cites data from the sources listed above. For the most current figures, consult the original publications directly.
Data current as of publication date. Market conditions, rates, and regulations may have changed. Consult a qualified commercial real estate professional before making investment decisions.
Get the full Central MA market data
Commercial tax-base growth, development activity, and demographics across Central MA, town by town.